Appearance
Activity Reports
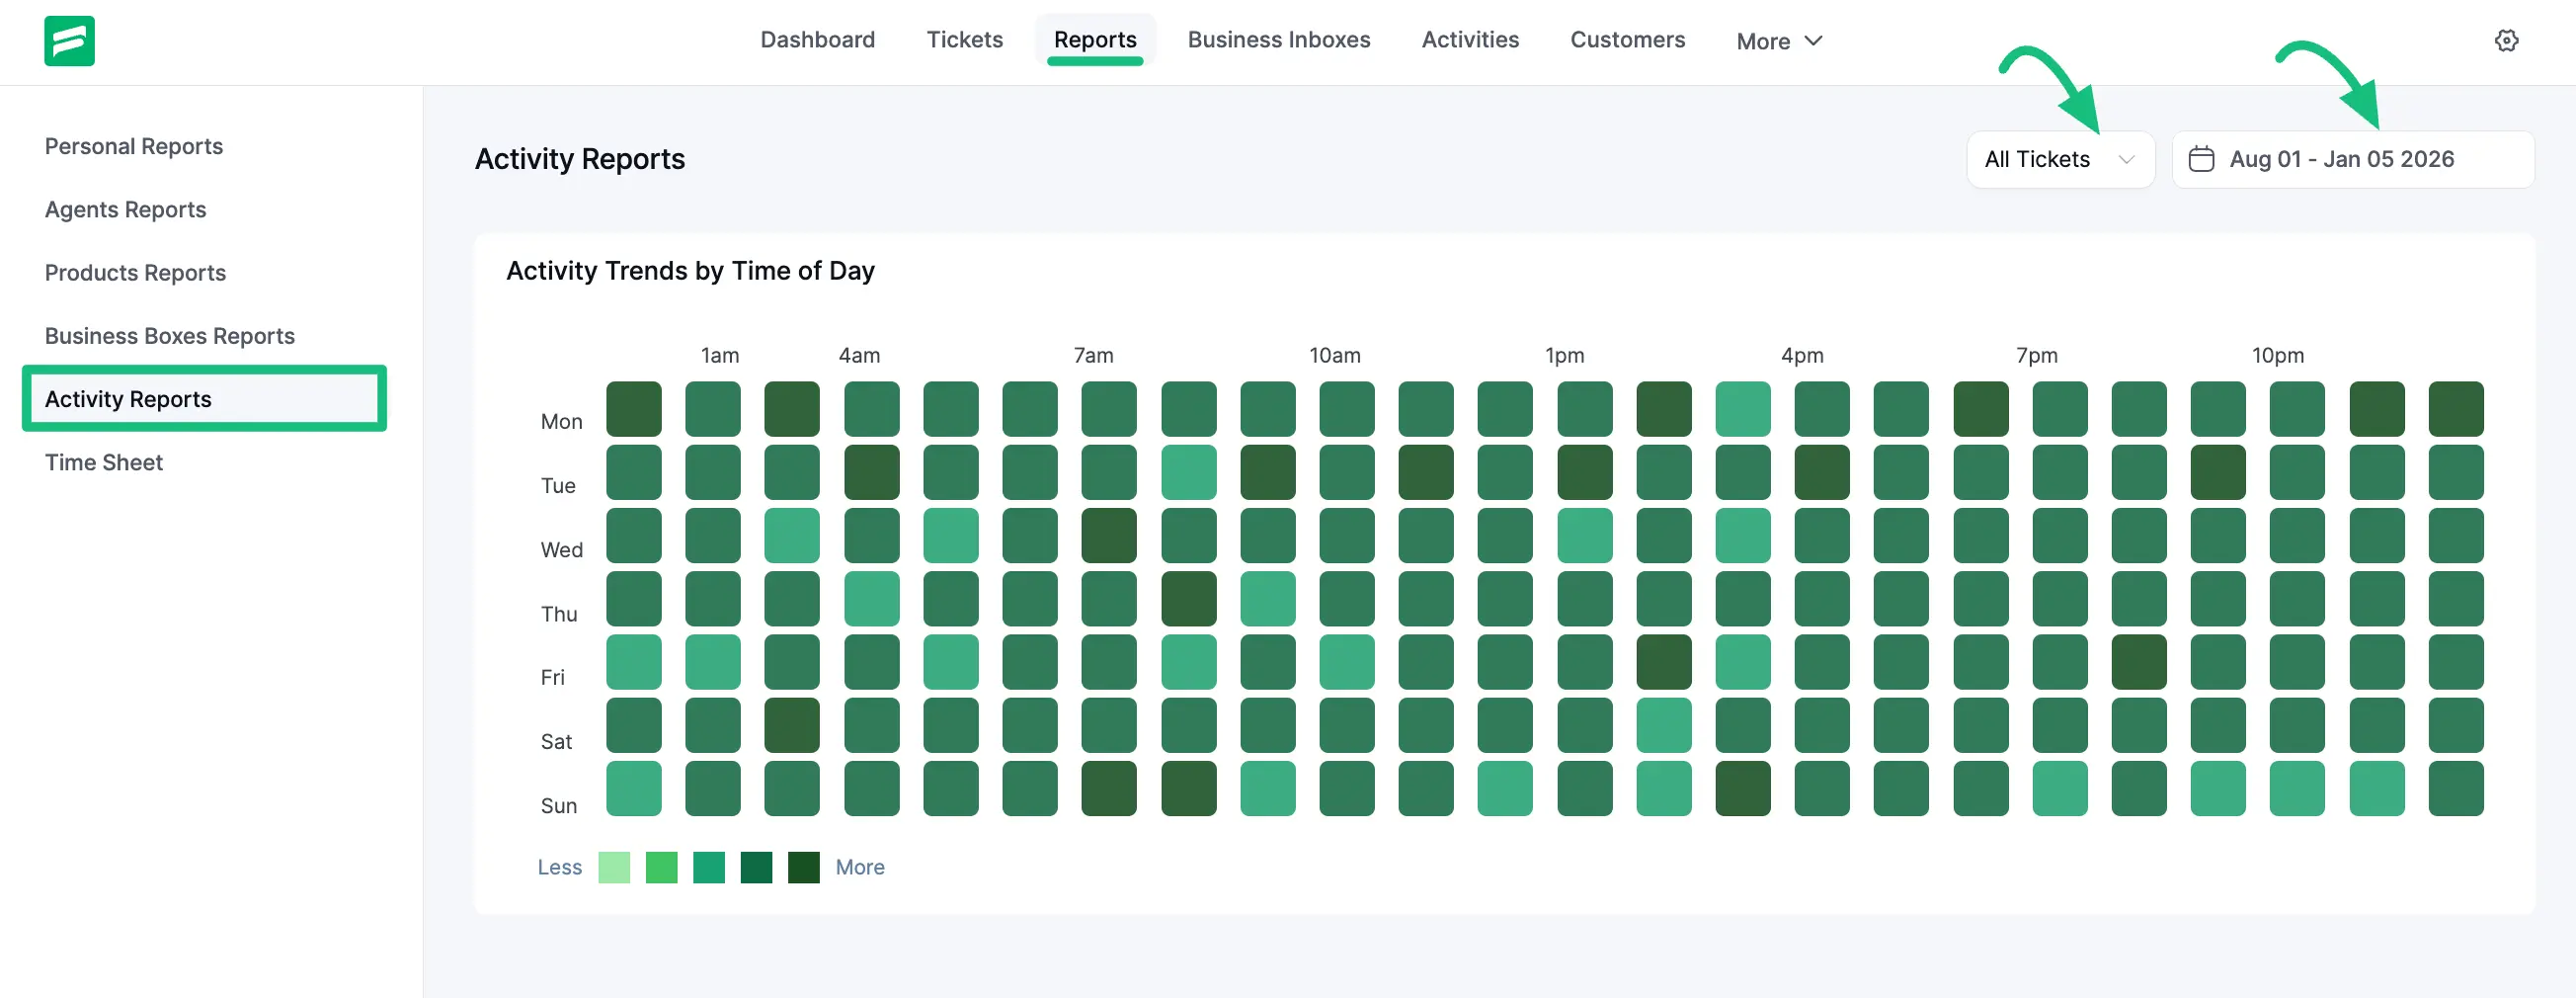
The ‘Activity Reports’ section shows the overall report of all ticket statistics and summaries using a heat map visualization based on customers' and agents' activities. This provides a visual representation of when your support system is busiest.
Accessing Activity Reports
To access the activity reports, navigate to the Reports tab from the top menu and select Activity Reports.
Activity Trends by Time of Day
This section visualizes activity levels throughout the week using a grid system:
Grid Structure: The grid maps days of the week (Mon-Sun) against hours of the day (01 am to 10 pm).
Heat Map Indicators: The color intensity represents the volume of activity:
- Light Green: Represents fewer activities.
- Dark Green: Represents more activities (peak times).
Filtering Options
You can customize the data displayed in the heat map using several filters available at the top right of the chart:
- Response Type Filter: You can choose to view statistics for All Tickets, Agent Response, or Customer Response.
- Agent Filter: When viewing "Agent Response," you can further filter by All Agents or select a specific agent from the dropdown list to see their individual activity patterns.
- Date Filter: Use the date picker to view ticket activity trends for a specific period.