Appearance
Dashboard Overview
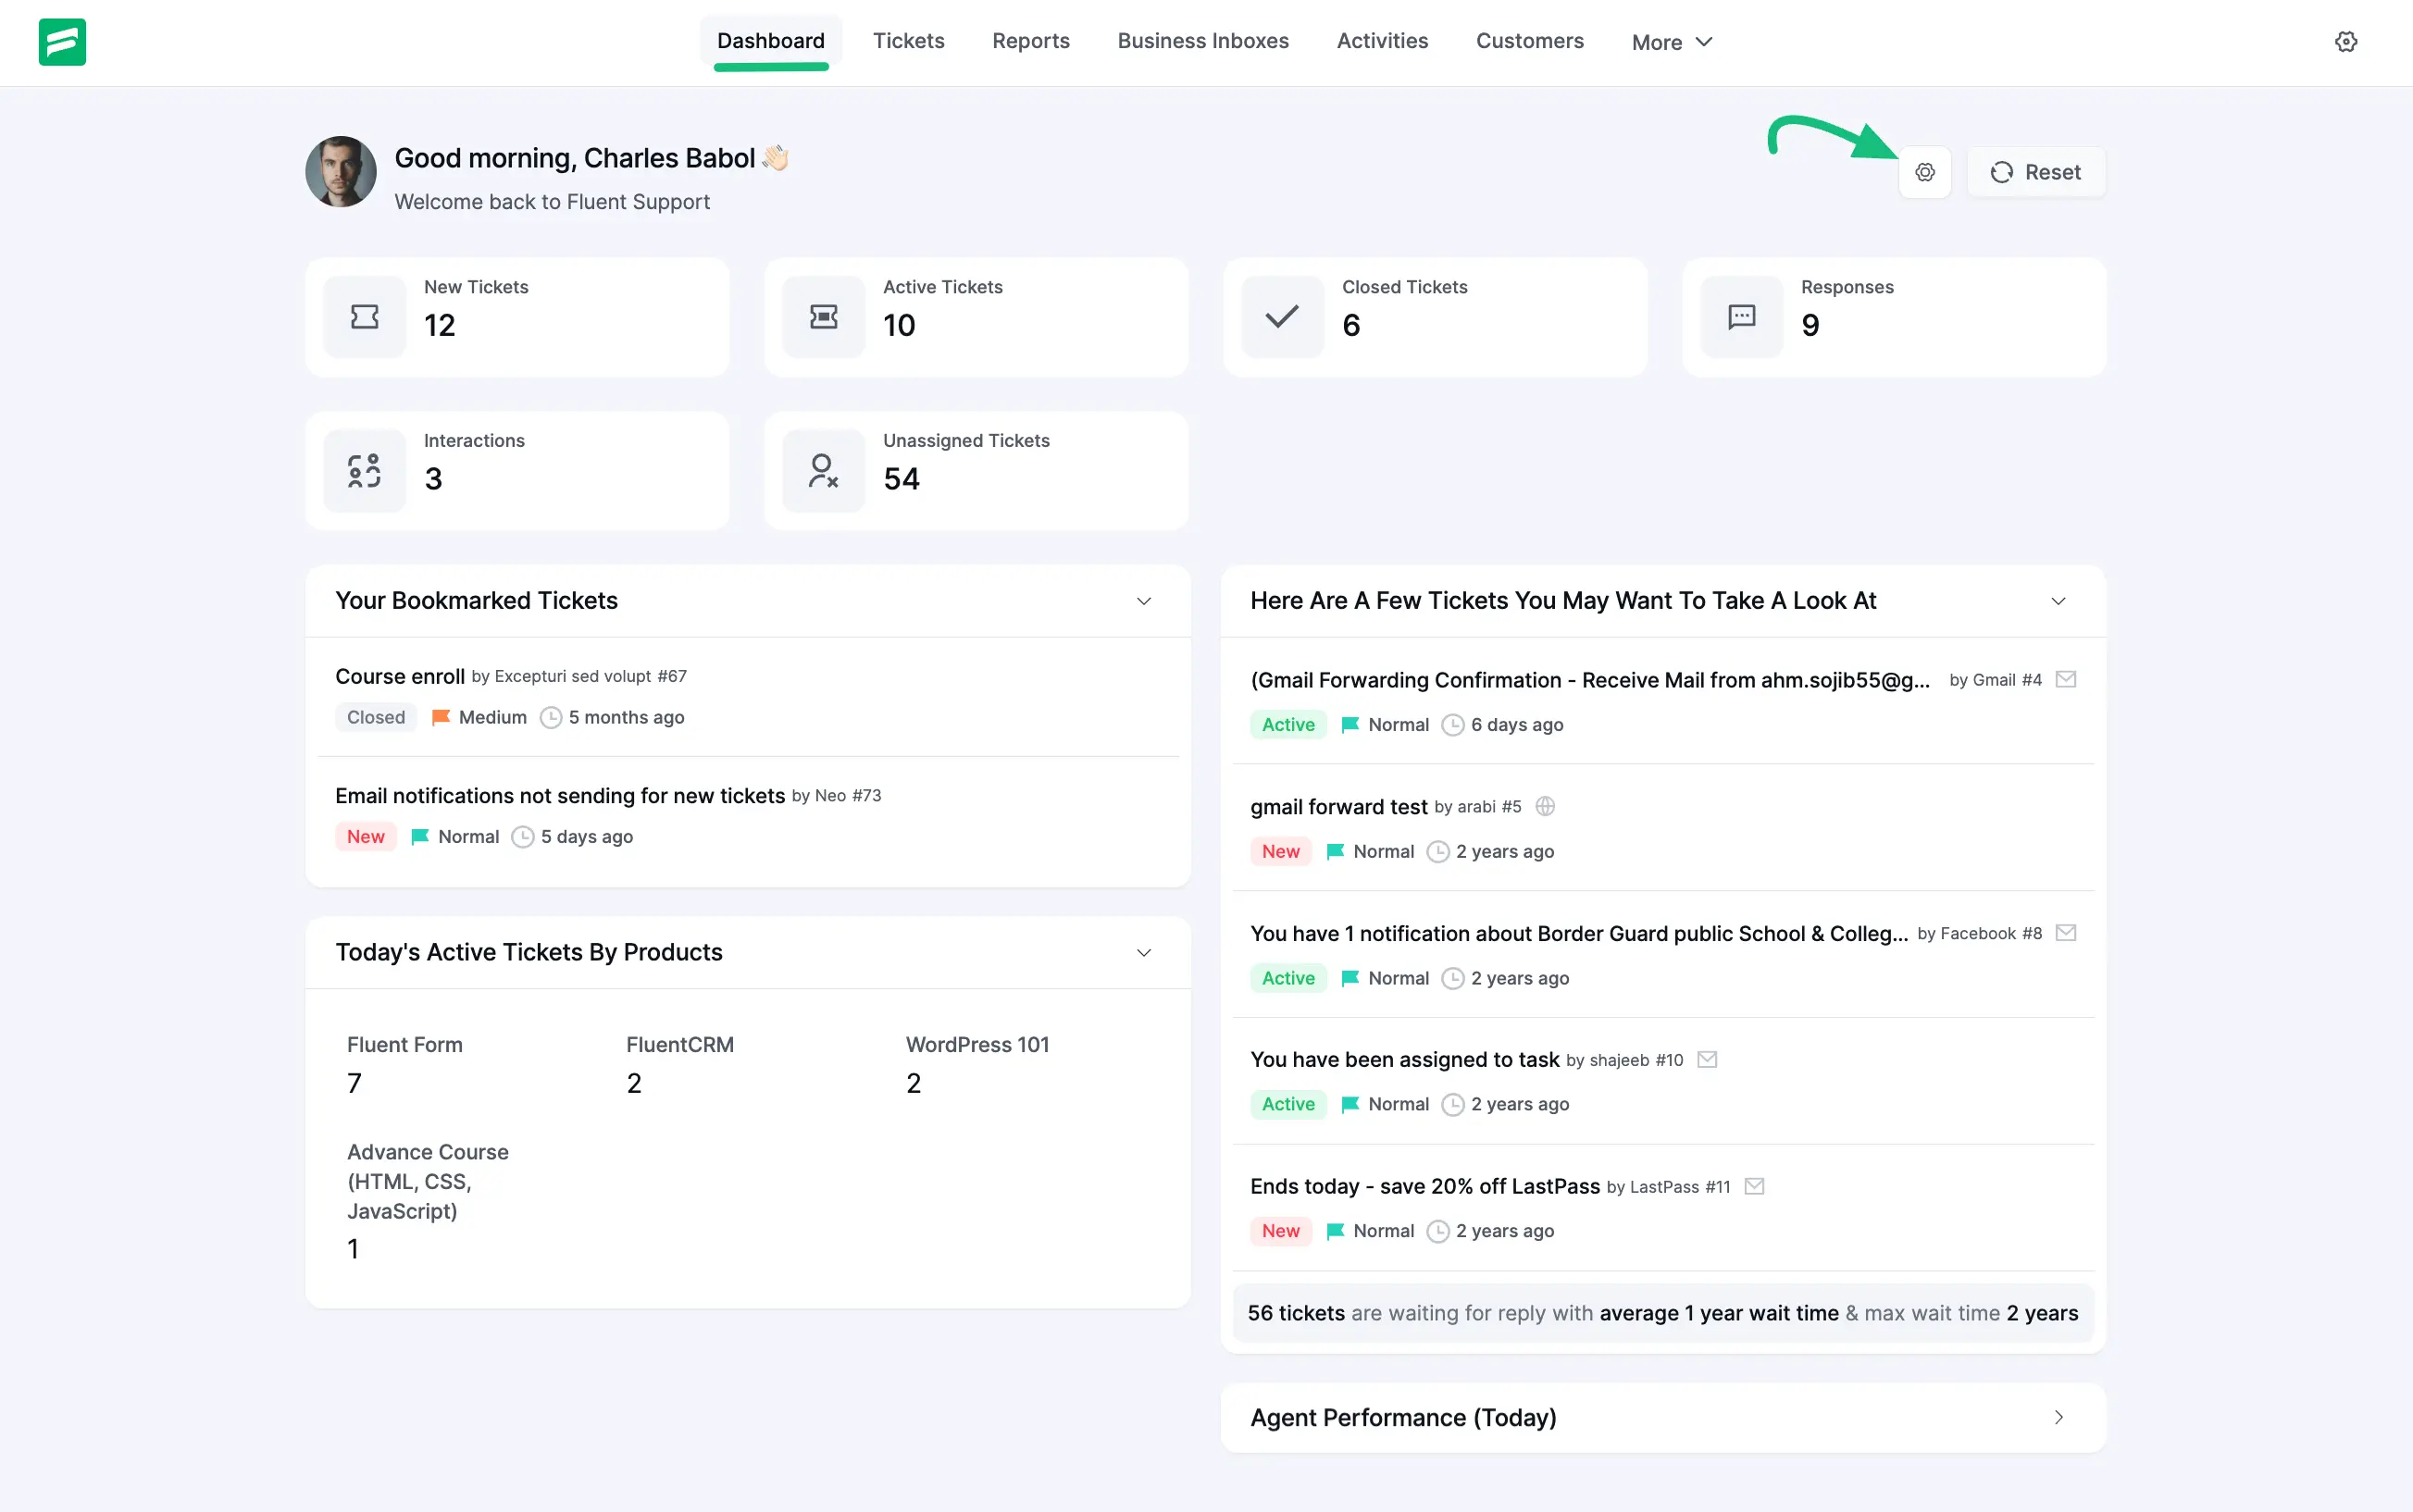
The Dashboard is the central command center of your Fluent Support system. It provides a real-time snapshot of your support operations, allowing you to monitor ticket volumes, track agent performance, and identify urgent issues at a glance.
This article will guide you through the various sections and widgets available on the Fluent Support Dashboard.
Accessing the Dashboard
To view your dashboard, simply navigate to Fluent Support in your WordPress admin sidebar. By default, the Dashboard is the landing page.
Dashboard Sections
The dashboard is organized into several key widgets designed to give you instant insights.
Quick Statistics Cards
At the top of the dashboard, you will find a set of counter cards that provide a summary of the current day's or overall activity.
- New Tickets: The number of tickets created recently that have not yet been replied to or assigned.
- Active Tickets: The total count of tickets currently open and in progress.
- Closed Tickets: The number of tickets resolved and closed today.
- Responses: The total number of replies sent by your agents today.
- Interactions: Counts the total touch points or interactions made within tickets.
- Unassigned Tickets: The number of tickets that are waiting to be assigned to an agent.
Ticket Suggestions Widget
On the right side, the section titled "Here Are A Few Tickets You May Want To Take A Look At" helps agents prioritize their workflow.
This intelligent widget highlights tickets that need attention based on waiting time and priority. For each ticket listed, you can see:
- Ticket Subject: The main title of the support issue (e.g., Gmail Forwarding Confirmation).
- Customer & ID: The name of the user who submitted the ticket along with the Ticket ID (e.g., by Gmail #4).
- Status Badge: A visual indicator of the ticket status, such as Active (Green) or New (Red).
- Priority: The priority level of the ticket (e.g., Normal, Medium, Critical).
- Wait Time: How long it has been since the last interaction (e.g., 6 days ago).
NOTE
At the bottom of this widget, you will often see a summary line indicating the total number of tickets waiting for a reply and the average wait time.
Today's Active Tickets By Products
If you have set up Products in Fluent Support, this widget categorizes your active tickets by product. This allows you to quickly see which products are generating the most support requests for the day.
Personal & Agent Widgets
To help individual agents manage their workload, the dashboard includes:
- Your Bookmarked Tickets: A quick access list of any tickets you have bookmarked for personal follow-up.
- Agent Performance (Today): A personalized stats box showing the logged-in agent's activity, such as their current status, number of closed tickets, and response counts for the day.
Header Navigation
The top menu bar within the Fluent Support panel provides quick access to other core areas:
- Tickets: The full list view of all tickets.
- Reports: Detailed analytics and graphs.
- Customers: Your database of user profiles.
- Saved Replies: Manage your canned responses.
- Activities: View system-wide logs.
- Business Inboxes: Manage multiple support channels.
- Workflows: Set up automation rules.
Dynamic Dashboard Customization
Fluent Support features a Dynamic Dashboard, allowing you to personalize your workspace by choosing exactly which widgets appear on your screen.
To customize your dashboard, Locate the Settings (Gear) Icon in the top right corner of the dashboard, with the Reset button. Click the icon to open the All Widgets sidebar panel.
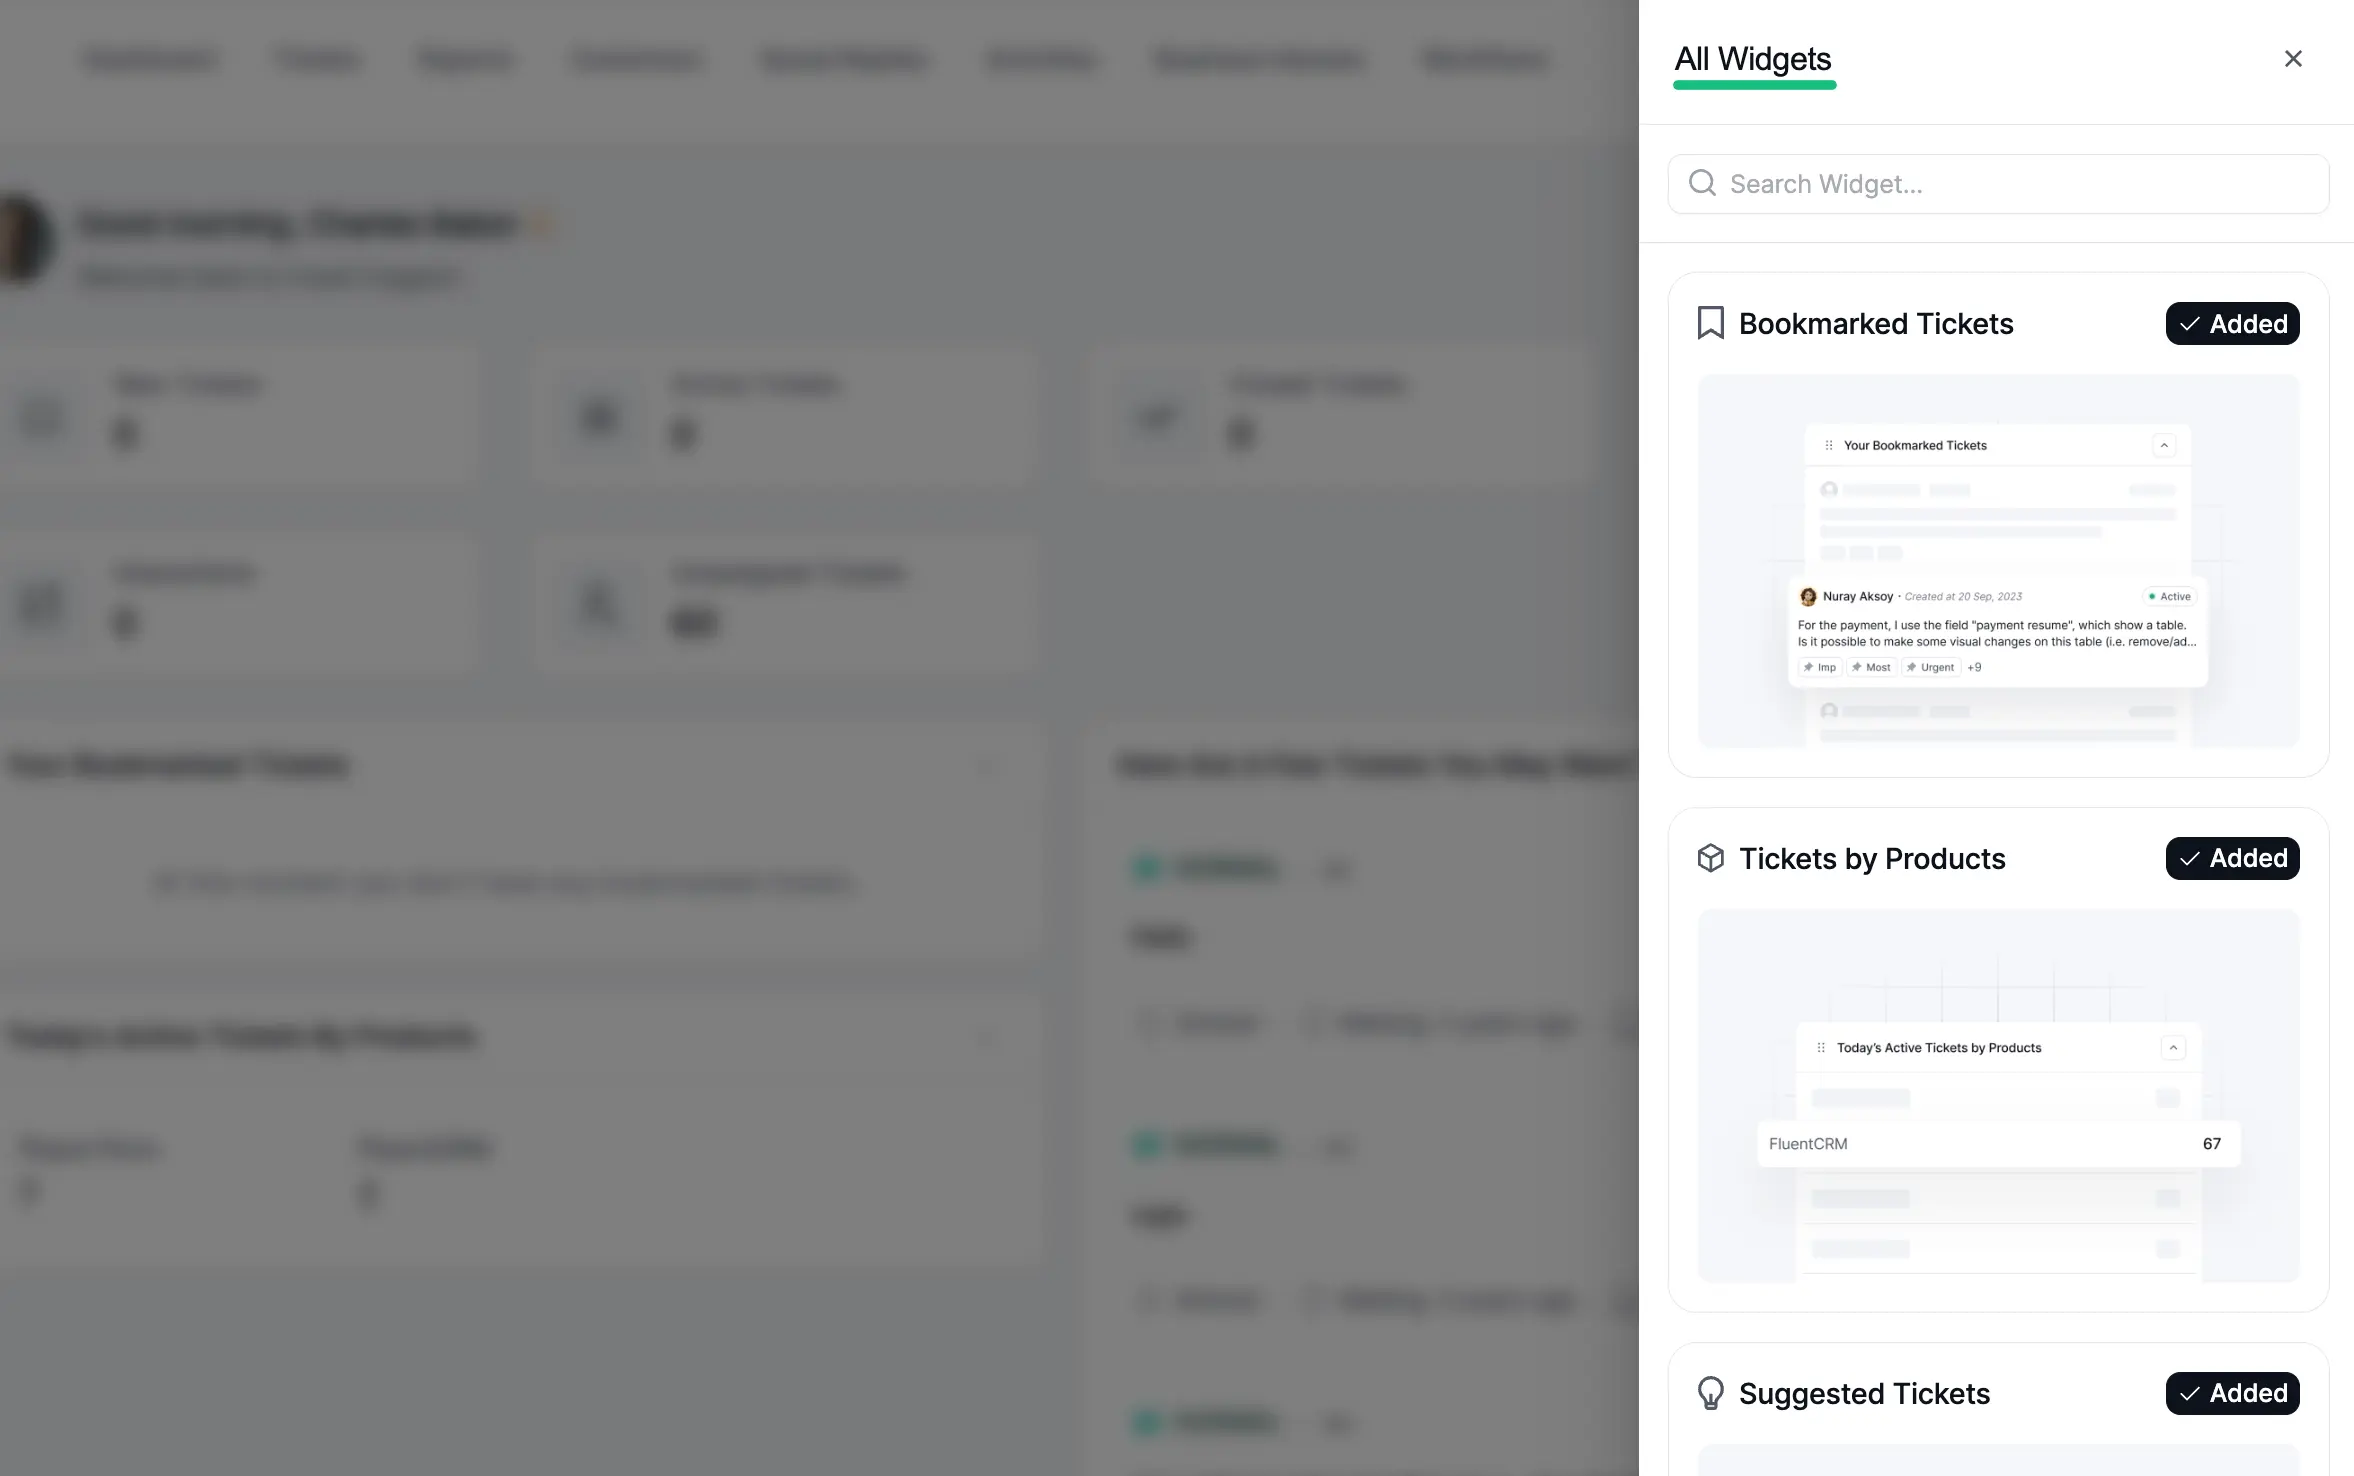
Managing Widgets
Once the All Widgets panel is open, you can manage your view:
- View Available Widgets: Browse the list or use the Search Widget... bar to find specific tools (e.g., Bookmarked Tickets, Suggested Tickets).
- Add/Remove Widgets: Click the button next to a widget to add it to your dashboard. If a widget is already displayed, it will be shown as 'Added' with a checkmark.
This feature ensures that your dashboard remains clean and relevant to your specific role or daily tasks.
NOTE
Remember: You can use the Reset button near the greeting to refresh your dashboard widgets and ensure you are seeing the most up-to-date data.